If you run an agency or manage a marketing team, you know the Friday nightmare: Logging into Google Analytics, exporting to CSV, logging into Facebook Ads, exporting to CSV, pulling Stripe revenue, and spending two hours formatting a report your client will only glance at for 30 seconds.
Databox was built to assassinate spreadsheet reporting. It is a Business Intelligence (BI) tool that pulls all your scattered data into a single, beautiful, real-time dashboard. But is it easy enough to set up without knowing SQL? In this Databox review, we connected it to a live tech stack to see if it actually eliminates manual data entry.
Quick Summary
The Client Reporting Cheat Code
Google Looker Studio is free, but it breaks constantly and requires a data engineer to make it look decent. Databox wins because it "just works." You authenticate your accounts, pick a pre-built template, and instantly have a boardroom-ready dashboard that updates itself forever. It turns hours of manual labor into a single shareable link.
Start Building Dashboards for Free →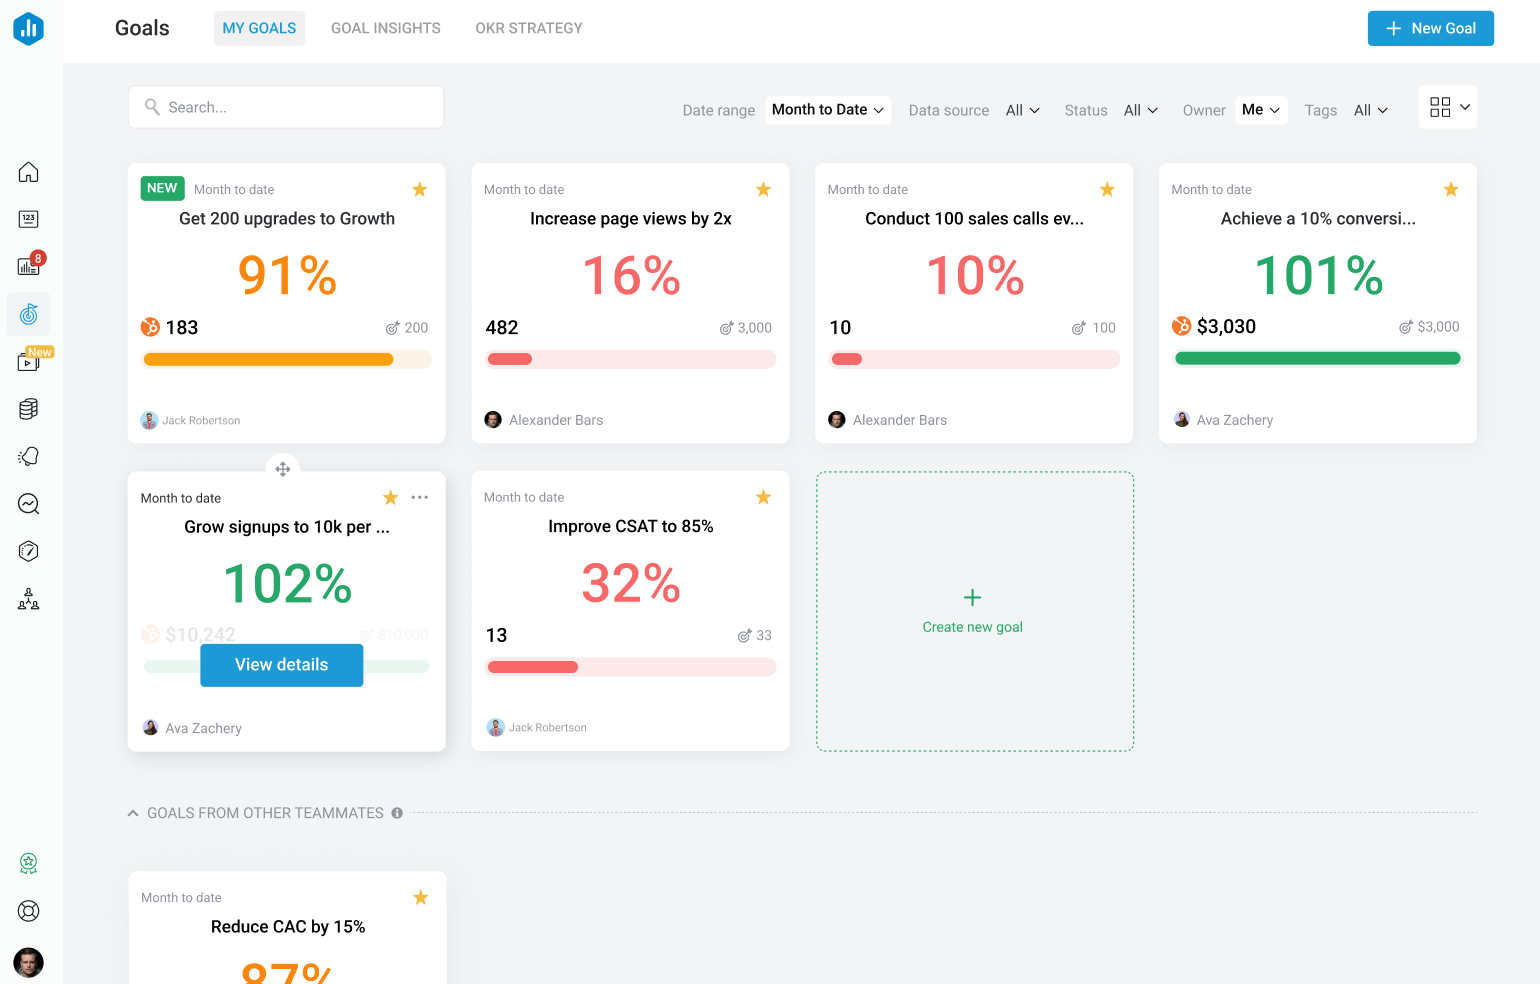
What Databox Actually Does
Databox is the central hub for your business metrics.
Instead of checking 10 different apps to see how your business is doing, you connect them all to Databox. It has native integrations with almost everything (HubSpot, Google Ads, Shopify, Stripe, Xero). You can place a widget showing "Stripe MRR" right next to a widget showing "Google Ads Spend," allowing you to instantly see the real-time ROI of your marketing efforts in one view.
Core Features
How to Use Databox — Workflow
We tested Databox by building a "CMO Master Dashboard" for an e-commerce client.
- The Connections: We clicked "Add Data Source" and authenticated Shopify, Facebook Ads, and Klaviyo.
- The Template: Instead of building from scratch, we browsed their library of 300+ templates and selected "E-commerce Full Funnel."
- The Customization: We dragged a "ROAS" (Return on Ad Spend) gauge next to the "Total Sales" bar chart.
- The Delivery: We generated a secure, white-labeled link and sent it to the client. The entire process took 12 minutes.
Example Use Cases
Who Databox Is Best For
- Non-Technical Managers: You do not need to know SQL, Python, or database engineering to use this tool. It is purely plug-and-play.
- Digital Agencies: The ability to duplicate a dashboard template across 20 different client accounts saves an unfathomable amount of time.
- Remote Teams: Daily automated Slack or email drop-ins of key metrics keep the whole team aligned without needing a meeting.
Who Should Avoid Databox
- Enterprise Data Scientists: If you need to perform complex joins on millions of rows of raw database data, you need a heavy BI tool like Tableau or PowerBI. Databox is for high-level KPI tracking.
- Bootstrapped Solopreneurs: If you only use Google Analytics and nothing else, just look at Google Analytics. Databox is valuable when you have multiple data sources to combine.
Pricing & Data Limits
Databox scales its pricing based on the number of Data Source connections and Data Boards (dashboards) you need.
| Plan | Price (Monthly) | Key Allowances |
|---|---|---|
| Free | $0 | 3 Data Sources, 3 Dashboards. Great for a single project. |
| Starter | ~$59 /mo | 4 Data Sources, 4 Dashboards, Hourly Syncs. |
| Professional | ~$169 /mo | Up to 50 Data Sources. Custom branding and hourly syncs. |
Best Practices: "The Alpha Plan"
To truly win in the agency space, you must execute the Alpha Plan to beat other affiliates and competing agencies.
How Databox Compares
| Feature | Databox | Looker Studio | Klipfolio |
|---|---|---|---|
| Setup Speed | Minutes (Templates) | Hours (Manual) | Hours |
| Native Integrations | 100+ (1-Click) | Google Only (Requires 3rd Party) | High (Requires Config) |
| Ease of Use | High | Low | Medium |
| Cost | Starts ~$59/mo | Free (Plus Connector Costs) | Starts ~$142/mo |
Limitations & Reality Check
- Historical Data Limits: Depending on your tier, Databox may restrict how far back you can pull historical data (e.g., 11 months on Starter, 24 months on Pro). If you need 5 years of look-back data, you'll need the higher tiers.
- Custom Metric Complexity: If you want to create a highly complex, blended metric (e.g., combining data from three different platforms using a custom mathematical formula), Databox's "Data Calculations" feature works, but it takes some trial and error to master.
Pros & Cons
- Zero coding required; genuinely drag-and-drop.
- Hundreds of pre-built templates for almost every software.
- Automated Slack and Email reports keep stakeholders informed.
- Exceptional mobile app for checking stats on the go.
- Pricing scales quickly if you need dozens of data sources.
- Historical data look-backs are limited on entry-level plans.
- Not built for raw SQL database querying.
Frequently Asked Questions
Is Databox better than Google Looker Studio?
For non-developers, absolutely. Looker Studio requires you to pay for third-party connectors (like Supermetrics) to pull non-Google data, and it breaks often. Databox maintains all connections natively so it "just works."
Can I white-label the dashboards for clients?
Yes. On the Professional plan and above, you can remove Databox branding, add your agency's logo, and host the dashboards on a custom domain.
What if my software isn't supported?
If an app doesn't have a native integration, Databox allows you to push data via their API, use Zapier/Make, or even sync data directly from a Google Sheet.
Does it update in real-time?
Depending on your plan, data syncs range from daily to hourly to near real-time. For most marketing and sales use cases, hourly syncing is more than sufficient.
Final Verdict
Time spent manually compiling reports is time you are not spending growing your business or acquiring new clients.
Databox is an operational lifesaver. It turns the chaos of 20 different SaaS logins into a single, automated source of truth. If you value your time and want to present a highly professional, data-driven image to your clients or CEO, Databox is worth every penny of the subscription.
Automate Your Reporting Today (Free Plan) →